Database Development
Defining Tables to Capture Holocaust Ghettos
In my work with the Holocaust Geographies Collaborative and especially Dr. Anne Knowles, we investigated the spatial history of ghettos in German-occupied Eastern Europe during World War II. The task was to map and analyze select information out of the United States Holocaust Memorial Museum Encyclopedia of Camps and Ghettos, 1933-1945, Volume II: Ghettos In German-Occupied Eastern Europe. To create data out of encyclopedia entries written by historians for reference reading, often based on incomplete or vague source information, we carefully developed definitions of data fields and guidelines for interpretation of encyclopedia text into data. This resulted in data entry guidelines for what we called the Basic Attributes Table and the Physical Characteristics Spatial Table.
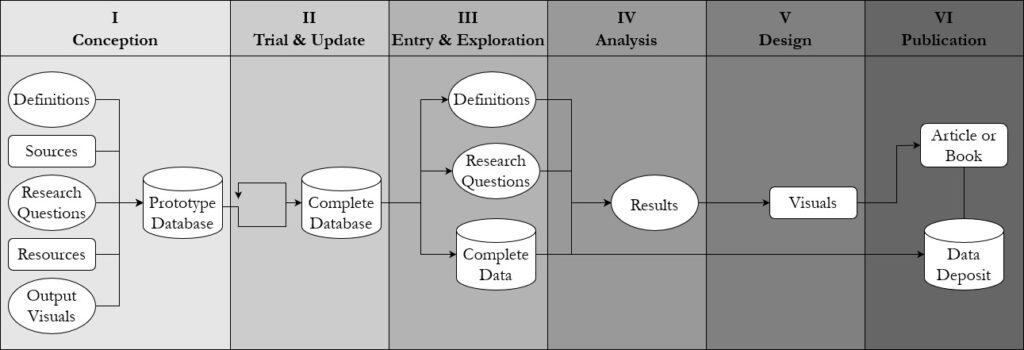
We created these iteratively and collaboratively, going back and forth between reading, interpretation, trial data entry, and group discussion to improve the emerging data table. A shown in phase I below, this process was guided by our:
- definitions of the historical phenomena we wanted to capture, most of all the ghetto,
- research questions centered on Jewish experience and spatial characteristics of ghettos,
- sources and the kinds of information it contains,
- desired output visuals, which were mostly maps, and
- resources, so the time our team members could invest for data entry and the funding available to pay them.

This iterative process then further shaped what we wanted to know and what we found to be possible to achieve. It is truly amazing what detailed close reading and historical interpretation into data can reveal about a topic and how it has been traditionally written about. We soon realized we were more interested in the process of ghettoization rather than the ghetto which required an adapted definition of what we considered to be a ghetto in the first place. Counter to the popular image of large, walled ghettos, we found the variation in ghettos to be their hallmark characteristic, ranging from single buildings to whole neighborhoods, from no enclosures to barbed wire fences, from durations of less than a month to several years.
The results of our scholarly work was thus not just what we found when analyzing the data we had entered, but the concepts and definitions expressed in our data documentation informing what we found. We published an article about both in the International Journal for Humanities and Arts Computing.
